A chaotic system is one in unstable equilibrium. This means that the slightest change in starting conditions may lead to very different outcomes. This may not mean what is meant by chaos in common English, but the interesting chaotic systems may possess intricate structure.
We will give two examples.
The first uses a very simple quadratic equation
	 y = rx(1-x), for r between 2 and 4.
We start with values for x and r and then use the iteration formula
	xnew = r*xold*(1 - xold).
If we begin with r = 2.1 and xold = 0.5 we get
	xnew = 2.1*0.5(1 - 0.5) which is 0.525
Applying the same formula to xold = 0.525 we get
	xnew = 2.1*0.525*(1 - 0.525) which is 0.5237

Keeping the same starting value of x = 0.5 we compute 100 of these values,
discard the first 80, and list the values after that to see what happens
with different values of r.

If r = 2.5 the series is 0.6, 0.6, 06, ...

If r = 3.1 the series is 0.558074, 0.764566, 0.558074, 0.764566, ...
Since it repeats itself after two values, we say this is a cycle of length 2.

If r = 3.5 the series is 0.38282, 0.826941, 0.500884, 0.874997,
        		0.38282, 0.826941, 0.500884, 0.874997, ...
     which is a cycle of 4.

If r = 3.55, the series is a cycle of 8, but when r = 3.6 we are able to
detect no pattern or cycle at all. Similarly for values of r greater than 3.6,
except for the value r = 3.83 when we find a cycle of length 3. It is
    0.957417, 0.156149, 0.504667, 0.957417,...
This certainly indicates an unstable system, but there is
some inherent pattern which we can recognize more clearly in a graphical form.
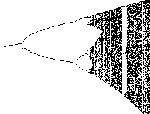
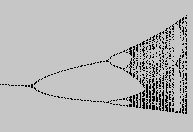
We will graph the values of x against the values of r. A graph is

Since r = 2 at the left end and r = 3.9 at the right end it is clear where the areas of 2 cycles, 4 cycles, and even 8 cycles appear. To account for the 3 cycle at 3.83 we show an expanded graph beween r = 3.825 and r = 3.86 for the small "window" in the chaos around it.

Finally, to show one step of self-similarity we expand the small "fork" at the bottom of the original graph.


This method also shows the self-similarity of fractals. If we enlarge a small part of this graph, for example the largest "bead" in upper center of the graph, we see:

If we do this again using the intersection in the upper right hand corner we see:

To return to the idea of chaos, we will show how sensitive this system is to certain starting values.

If we look at a small section of the graph at the line z = 0.01i from the real part x = -1.0 to x = 0 in the first line above we see that there are points along this line which lie in each of the three basins of attraction, since there are red, green, and blue points on the line. If we zoom in on the graph to show only the portion from x = -0.783 to x = -0.782 we see that there are still points in each of the three basins of attraction, as we see in the second line above. To further show the instability, we zoom in again to show the portion from x = -0.7825 to x = -0.7823 in the third line. Finally, we zoom in one more time to x = -0.78238 to x = -0.78234 in the last line. Another way of pointing up this same sensitivity is by considering the points
	     x		basin
	_____________________
	-0.78240	green
	-0.78242	red
	-0.78244	blue
	-0.78245	green
	-0.78246	blue
	-0.78248	red
	-0.78250	blue
It is even more interesting to note that between the first two points above is the point x = -0.782413 which lies in the blue basin, between the second and the third points is x = -0.7824333 which lies in the green basin, and between the third and the fourth points we find -0.7824495 which lies in the red basin! Certainly this is a very sensitive area of the graph.
Additional material is available at the following sites: